Tool · City heatmap
See where the city lives and works.
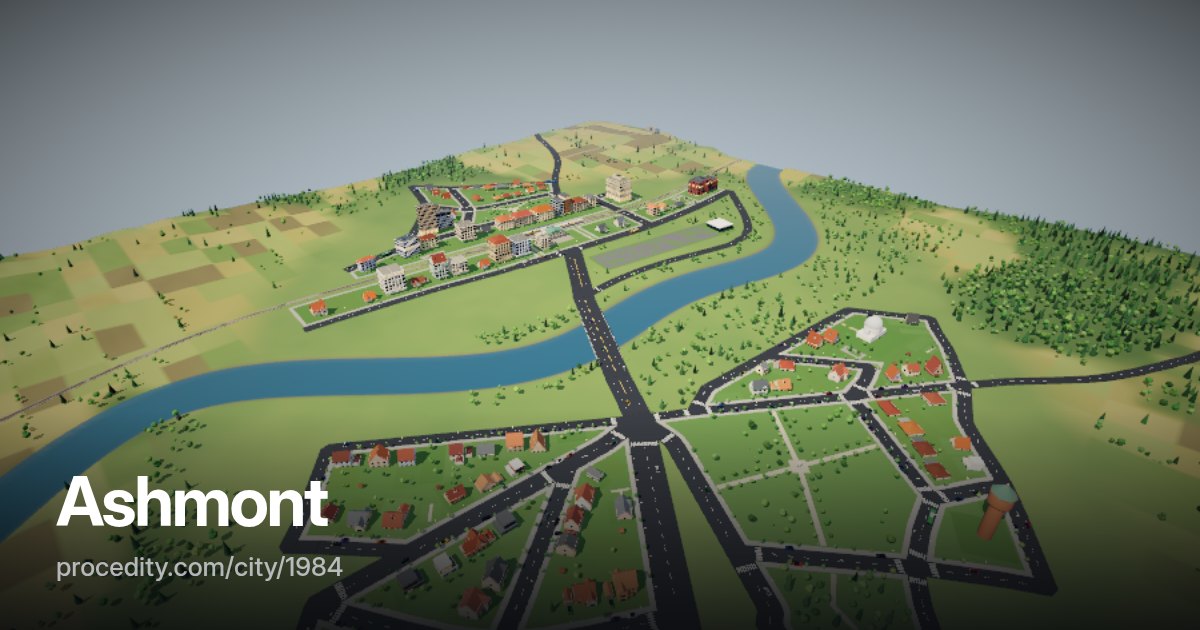
Every building in a generated city has a use and a size, so the city knows how many people live in each block and how many work there. The heatmap turns that into a colour wash right over the 3D streets.
How it works
Pick a map, read the city
-
Choose a map
Residents, jobs, floor area, greenery or road length – keys 1 to 5 switch between them.
-
Set the detail
Cells of 16, 24 or 48 metres, and the opacity of the wash over the city.
-
Hover to read
Point at any block to see the exact value of its cell.
The tool
A city's data as a picture
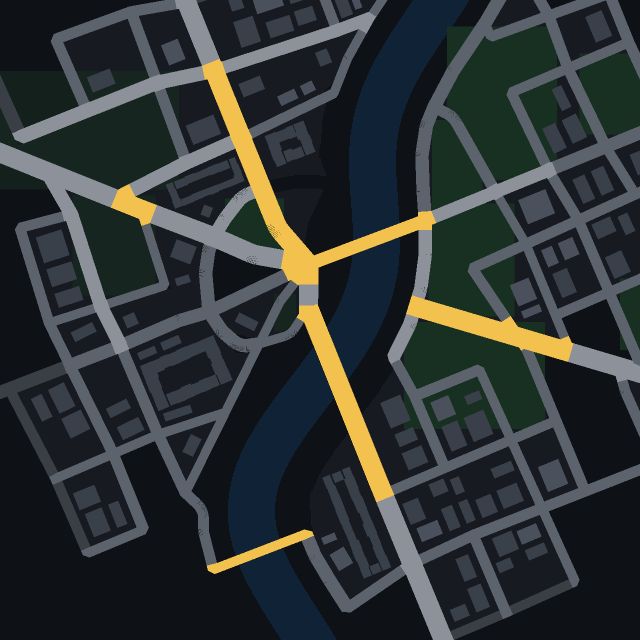
The heatmap shows what the generator built: a dense centre full of jobs, residential districts around it, industry by the railway, parks and a river cutting through. Compare residents with jobs and you see where the morning commute will go.
It is built on the public City API grid query – the same data any developer can read to build their own tool.
City heatmap at a glance
- Maps
- Residents, jobs, floor area, greenery, roads
- Cell size
- 16, 24 or 48 metres
- Data
- City API, the same for every seed
Keep exploring
More to try
-
 Tool
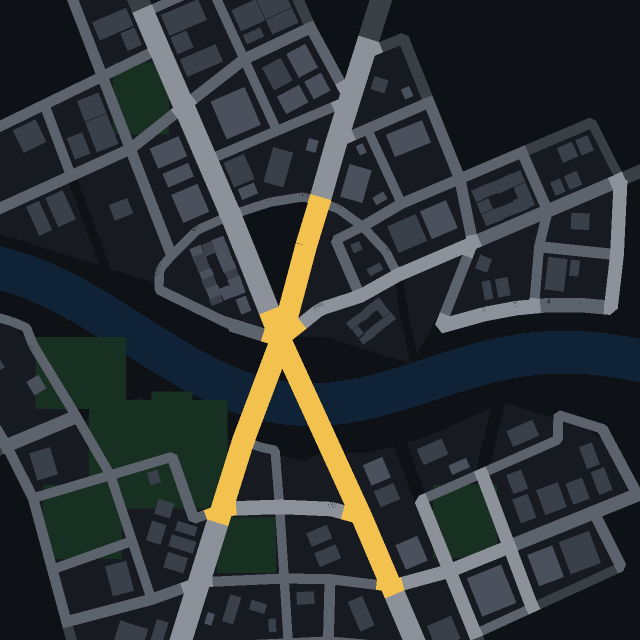
Isochrones
Click a street and see how far a car gets in 30 seconds, one and two minutes.
-
 Tool
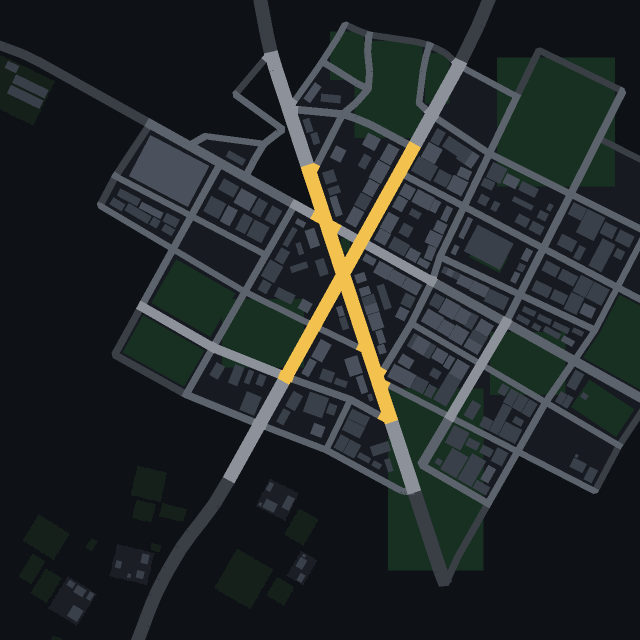
Road centrality
Which streets hold the city together? See the roads most routes across town have to use.
-
 Tool
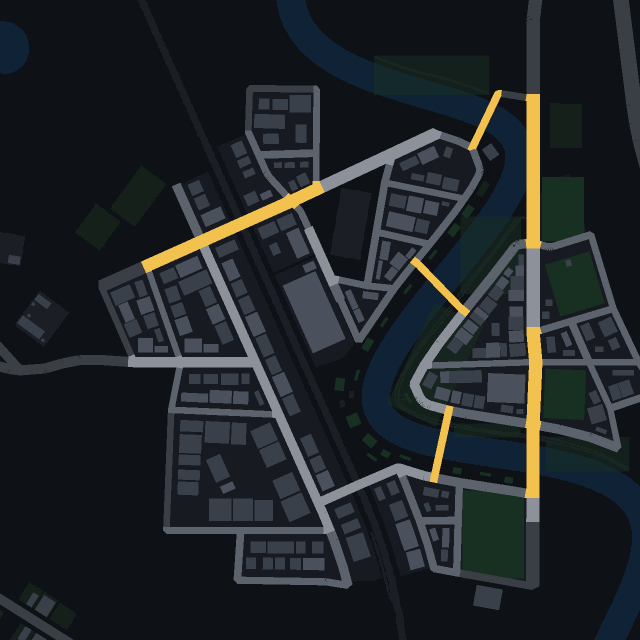
Transit map
Every railway, tram and bus line of the city, with its stops, drawn right on the streets.
-
 Game
Find the car
One car in town has a colour no other car has. Spot it in traffic as fast as you can.